Your Unfair Advantage in Every Headline
28+ financial sources scanned. 14 technical indicators run. Structured scenarios with context, reasoning, and risk analysis.
For informational and educational purposes only. Not financial advice. Not regulated by the Central Bank of Ireland. Past performance is not a reliable indicator of future results. Full disclaimer
Every Scenario, Stress-Tested
Numbers, context, and conviction — not vibes.
28+ Financial Sources
Wall-to-wall coverage
SEC filings, FDA releases, Fed announcements, MarketWatch, CNBC, Yahoo Finance, and more — all scanned in real time.
Conviction Scoring
Cut through the noise
Each scenario scored 1–10 on catalyst strength, technical alignment, and sentiment convergence.
Three Timeframes
Intraday to swing, one view
Immediate, short-term, and swing scenarios — each tuned with timeframe-appropriate parameters.
14 Technical Indicators
Regime-adaptive signals
Trend, momentum, volume, and volatility signals — weighted automatically based on current market conditions.
Hallucination-Proof
AI you can actually trust
Multi-pass verification catches fabricated facts, wrong tickers, and phantom catalysts before you see them.
Outcome Tracking
Proof, not promises
Every past scenario tracked against real outcomes. See what hit, what missed, and why.
Multi-Stage AI.
Zero Guesswork.
Every scenario passes through a rigorous multi-step pipeline — not a single prompt. The result: structured analysis with context, reasoning, and risk assessment built in.
- Catalyst Extraction
Identifies market-moving events from SEC filings, earnings, and macro data
- Technical Analysis
14 indicators run across 3 timeframes with regime-adaptive weighting
- Sentiment Synthesis
Cross-references source sentiment with market positioning
- Devil's Advocate
Challenges every thesis for flawed reasoning and priced-in catalysts
NVIDIA Files 8-K: Board Authorizes $25B Share Repurchase Program
Source data verified against primary filings
Symbol, exchange, and company confirmed
Checked against market pricing and positioning
Thesis stress-tested for weak reasoning
Verified Before
You See It
Every scenario passes through multi-pass verification that catches fabricated facts, wrong tickers, and phantom catalysts — before they ever reach your dashboard.
Unlike raw AI outputs, our pipeline validates every claim against source data and challenges every thesis with a dedicated adversarial review.
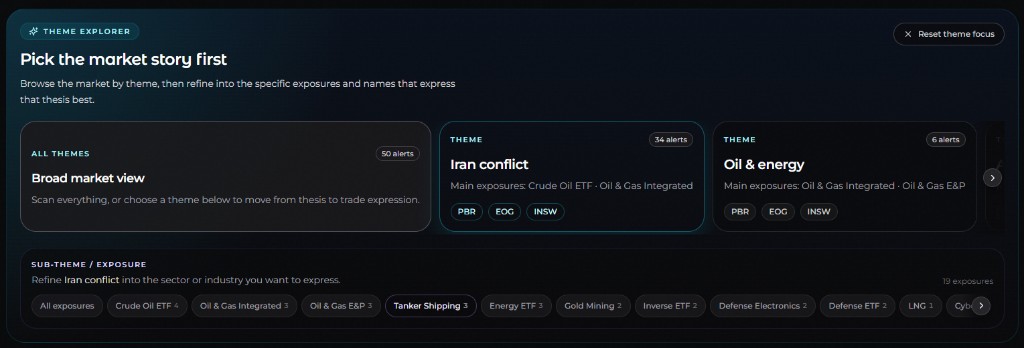
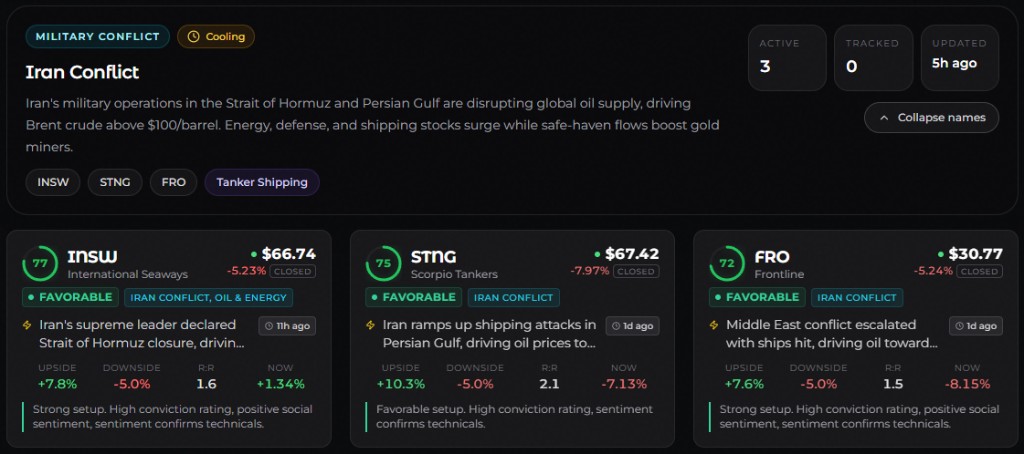
See It in Action
Real-time market summaries, scenario cards, and screening logs — all in one view.
Frequently asked questions
Our AI-generated scenarios include catalyst analysis, sentiment context, and risk/reward ratios for informational and educational purposes only. Markets are unpredictable and past performance is not a reliable indicator of future results. These are hypothetical scenarios, not financial advice or recommendations to trade.
The dashboard refreshes automatically, so new AI-generated scenarios appear within minutes of the underlying news being detected.
We cover all major US exchanges including NYSE, NASDAQ, and AMEX. Our coverage spans all sectors including technology, healthcare, finance, energy, consumer goods, and more. We also monitor ADRs of major international companies.
Yes — the dashboard lets you filter by active, tracked, bullish, bearish, and high-score scenarios. You can also search by ticker and sort by newest or highest score.
Select a plan on the Pricing page and complete checkout. After subscribing, you can access the dashboard to view AI-generated scenarios, market summaries, and breaking news. There is no free tier — access starts after payment, and you can cancel anytime.
You can cancel your subscription at any time with no questions asked. Simply go to your account settings and cancel. You will continue to have access until the end of your billing period.
Ready to get started?
Start with a flexible plan and upgrade or cancel anytime.